In mid-2019 I posted a global temperature analysis that showed how we might have a first 1.5°C year sooner than many were imagining. This built on a 2016 story I posted. My 2016 analysis was catalysed by the significant jump in temperature the world experienced that year as a very strong El Niño event took hold. In February of 2016 the world had experienced the first month in which the global temperature anomaly was over 1.5°C higher than pre-industrial times (represented by the 1850-1900 baseline and as reported by NASA/GISS). As the El Niño subsided the elevated warming also reduced, but it left me thinking that the next strong El Niño might deliver a first 1.5°C year rather than just a single month. With El Niño emerging again in 2023, are we now at that point?
In recent weeks and months we have seen a number of media stories about the global temperature reaching unprecedented levels with societal alarm bells ringing about the situation. The current El Niño event started in about April of this year with the Oceanic Nino Index (ONI) crossing from negative (La Niña conditions) to positive and rising since then. It is now at 1.3° and continuing to rise, but is not yet at the point of being a Strong or Very Strong event; the ONI has to be around 2.0° for that to be declared. According to a NOAA report on October 16th El Niño is favoured through to Northern Hemisphere spring 2024, with chances exceeding 95% through January-March 2024. Thereafter, chances of El Niño gradually decrease, with a possible return of ENSO-neutral (El Niño Southern Oscillation) in May-July 2024. So could 2023 be a 1.5°C year on the back of this?
Here is what we know.

With all that in mind, what can we say about the temperature so far this year and the possibility of 2023 exceeding 1.5°?
If we draw a chart that removes the underlying 0.2°C per decade warming, then we are left with the variation in annual temperature as a function of other factors, including the ONI. The latter typically varies between -2° (strong La Niña) to +2° (strong El Niño).
The chart below shows two annual trends. At the bottom in grey is the Oceanic Niño Index, which is now at about 1.3°, but during the Very Strong El Niño of 2015/2016 reached 2.6°. The orange line at the top is the ‘warming removed’ variation in global average surface temperature variation vs. 1850-1900. This appears to be just a very noisy chart, but the trend through it is flat which is important (meaning that the warming has been cleanly removed).

Eyeballing the chart might lead to the view that the variation is more positive in El Niño years and more negative in La Niña years, which it should be given this is a shorter term cooling and warming cycle. However, plotting the ONI vs. the anomaly variation (see the chart in blue below) doesn’t yield a strong trend. A regression of the data points with the intercept at zero gives a slope of around 0.1°C (actually 0.0731) of global temperature variation for each point of Oceanic Niño Index change. But a visual inspection of the data range (orange dotted lines) perhaps points to something more aggressive, possibly around 0.2°C for each point of Oceanic Niño variation. A more detailed statistical analysis of this is almost certainly required, which is beyond my university statistics. This may be challenging though as the data includes all possible reasons for short term variations, besides the ENSO. There’s volcanoes (e.g. Mt. Pinatubo in 1991), solar variances, sea ice cycles and perhaps even events like very major forest fires, to name a few.

If we were to assume a factor of around 0.15°C warming for each point in the ONI, then the temperature excursions seen over recent months are not surprising (although the very last month of the trend has really concerned the science community). Using the Berkeley Earth monthly time series, the monthly average temperature anomaly in 2018 was 1.2°C, in a year when ONI averaged very close to zero, i.e. neutral. Compared to 2018, then today which is five years later we would be at:
1.2 (2018 data) + 0.1 (underlying warming over five years) + 0.2 (1.3° * 0.15, current El Niño impact) = 1.5°C
The calculation above uses the current ONI of 1.3°, which is above the year to date average of around 0.5°, but it does show that we are in 1.5°C territory for 2023, which is concerning. There’s also a great deal of annual variability in the numbers. For example, starting with 2020 data (instead of 2018) when ONI averaged -0.4 (i.e. cooler La Niña period), but with the Berkeley monthly average anomaly at 1.35°C, then the same calculation comes out above 1.5°C.
Nevertheless, please note that the above analysis uses only the Berkeley Earth Data Set, which is one of several. In the World Meteorological Organisation (WMO) State of the Global Climate 2022 Report they included six datasets, of which Berkeley was one. Further, the IPCC use a ten year moving average temperature to assess the longer term state of the climate, which is still tracking well below 1.5°C but clearly rising. And if the world was back in a La Niña phase by 2025 the temperature in that year would likely be back below 1.5°C as well. As such, the recent temperature data and the possibility of 2023 or 2024 crossing the 1.5°C threshold serve as an important warning for the future.
As has been the case in recent COPs, we may see the WMO announce a final estimate for 2023 at COP28, before the complete data set is available in early 2024. Should an announcement point to 2023 being the first 1.5°C year it will certainly focus the minds of the negotiators in attendance as they contemplate the Global Stock Take and the COP28 declaration of action, expected to be finalised on December 12th.
In recent weeks and months we have seen a number of media stories about the global temperature reaching unprecedented levels with societal alarm bells ringing about the situation. The current El Niño event started in about April of this year with the Oceanic Nino Index (ONI) crossing from negative (La Niña conditions) to positive and rising since then. It is now at 1.3° and continuing to rise, but is not yet at the point of being a Strong or Very Strong event; the ONI has to be around 2.0° for that to be declared. According to a NOAA report on October 16th El Niño is favoured through to Northern Hemisphere spring 2024, with chances exceeding 95% through January-March 2024. Thereafter, chances of El Niño gradually decrease, with a possible return of ENSO-neutral (El Niño Southern Oscillation) in May-July 2024. So could 2023 be a 1.5°C year on the back of this?
Here is what we know.
- The underlying global temperature anomaly (i.e. global average surface temperature vs. 1850-1900) is rising at about 0.2°C per decade (in fact 0.0197 per year from 1975 to 2023 according to the most recent Berkeley Earth data) as more and more CO2 is added to the atmosphere.
- The recorded temperature anomaly (which the Paris Agreement is attempting to keep below 1.5°C) for a specific year is highly variable depending on annual climatic shifts, most notable being the El Niño Southern Oscillation (ENSO).
- ENSO has two distinct phases, El Niño when the mid-Pacific warms and we tend to see higher global temperatures and La Niña when there is cooling and we tend to see lower global temperatures.
- We have recently moved from a La Niña condition to an El Niño condition and that condition is growing.
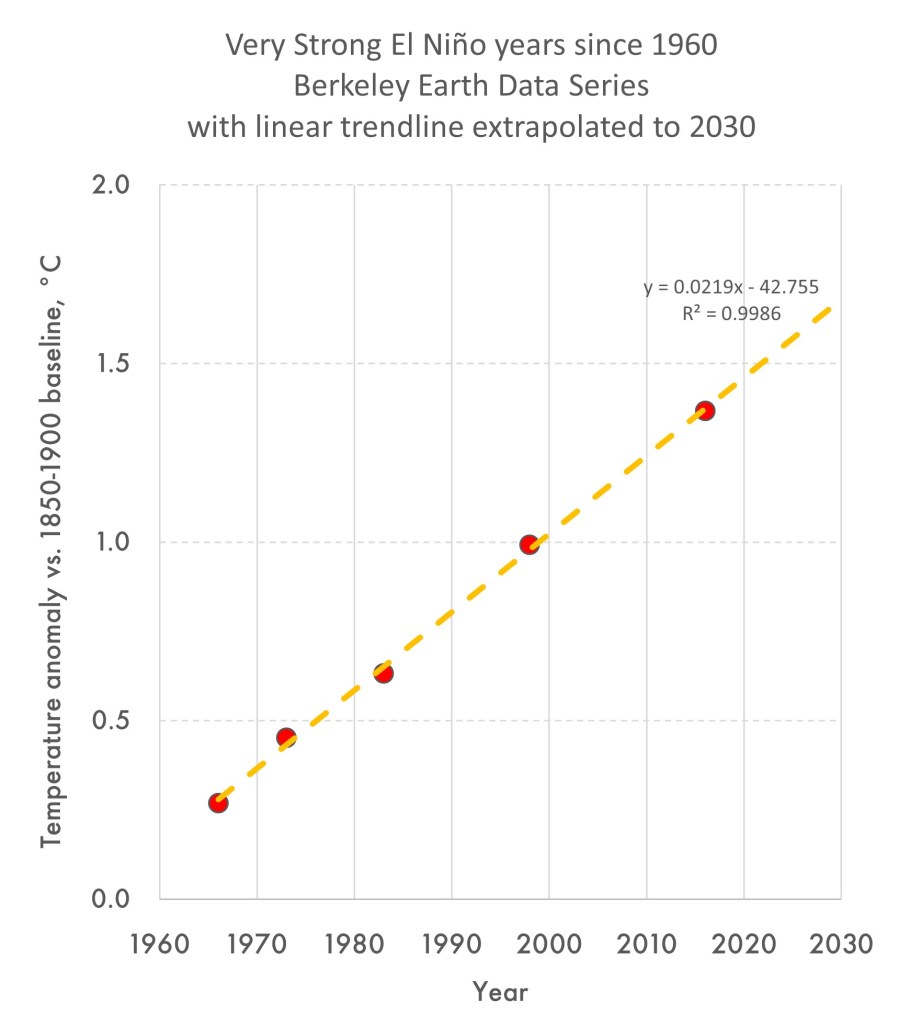
- Based on years in the last half century when we had a similarly strong to very strong El Niño (1966, 1973, 1983, 1998, 2016) and a consequent anomalously high global average surface temperature, we can see that in the near term if we move into Strong El Niño conditions, we will likely see the first 1.5°C year. In the chart below, this would be any time after about 2021.
- While 2023 isn’t a Strong El Niño year yet, we are heading in that direction (but that doesn’t mean we get there). The ONI continues to rise and for each year after 2021, the height that it needs to rise to for a first 1.5°C year will become progressively lower due to the underlying warming trend.
With all that in mind, what can we say about the temperature so far this year and the possibility of 2023 exceeding 1.5°?
If we draw a chart that removes the underlying 0.2°C per decade warming, then we are left with the variation in annual temperature as a function of other factors, including the ONI. The latter typically varies between -2° (strong La Niña) to +2° (strong El Niño).
The chart below shows two annual trends. At the bottom in grey is the Oceanic Niño Index, which is now at about 1.3°, but during the Very Strong El Niño of 2015/2016 reached 2.6°. The orange line at the top is the ‘warming removed’ variation in global average surface temperature variation vs. 1850-1900. This appears to be just a very noisy chart, but the trend through it is flat which is important (meaning that the warming has been cleanly removed).
Eyeballing the chart might lead to the view that the variation is more positive in El Niño years and more negative in La Niña years, which it should be given this is a shorter term cooling and warming cycle. However, plotting the ONI vs. the anomaly variation (see the chart in blue below) doesn’t yield a strong trend. A regression of the data points with the intercept at zero gives a slope of around 0.1°C (actually 0.0731) of global temperature variation for each point of Oceanic Niño Index change. But a visual inspection of the data range (orange dotted lines) perhaps points to something more aggressive, possibly around 0.2°C for each point of Oceanic Niño variation. A more detailed statistical analysis of this is almost certainly required, which is beyond my university statistics. This may be challenging though as the data includes all possible reasons for short term variations, besides the ENSO. There’s volcanoes (e.g. Mt. Pinatubo in 1991), solar variances, sea ice cycles and perhaps even events like very major forest fires, to name a few.
If we were to assume a factor of around 0.15°C warming for each point in the ONI, then the temperature excursions seen over recent months are not surprising (although the very last month of the trend has really concerned the science community). Using the Berkeley Earth monthly time series, the monthly average temperature anomaly in 2018 was 1.2°C, in a year when ONI averaged very close to zero, i.e. neutral. Compared to 2018, then today which is five years later we would be at:
1.2 (2018 data) + 0.1 (underlying warming over five years) + 0.2 (1.3° * 0.15, current El Niño impact) = 1.5°C
The calculation above uses the current ONI of 1.3°, which is above the year to date average of around 0.5°, but it does show that we are in 1.5°C territory for 2023, which is concerning. There’s also a great deal of annual variability in the numbers. For example, starting with 2020 data (instead of 2018) when ONI averaged -0.4 (i.e. cooler La Niña period), but with the Berkeley monthly average anomaly at 1.35°C, then the same calculation comes out above 1.5°C.
Nevertheless, please note that the above analysis uses only the Berkeley Earth Data Set, which is one of several. In the World Meteorological Organisation (WMO) State of the Global Climate 2022 Report they included six datasets, of which Berkeley was one. Further, the IPCC use a ten year moving average temperature to assess the longer term state of the climate, which is still tracking well below 1.5°C but clearly rising. And if the world was back in a La Niña phase by 2025 the temperature in that year would likely be back below 1.5°C as well. As such, the recent temperature data and the possibility of 2023 or 2024 crossing the 1.5°C threshold serve as an important warning for the future.
As has been the case in recent COPs, we may see the WMO announce a final estimate for 2023 at COP28, before the complete data set is available in early 2024. Should an announcement point to 2023 being the first 1.5°C year it will certainly focus the minds of the negotiators in attendance as they contemplate the Global Stock Take and the COP28 declaration of action, expected to be finalised on December 12th.